Cloud
Video
CCC Board of Governors
Support
More
Calbright
Event Coverage
Register
Sign In
Media
13-5.2.3 Probabilities involving two rolls of a die - decimal answers
13-5.1.6 Outcomes and event probability
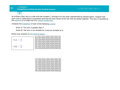
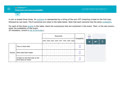
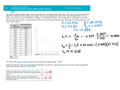
13-4.2.3 Computing r and the coeff. of the least squares reg. line
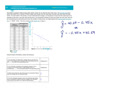
13-4.2.3 and 4.2.4 Interpreting the slope and the equation of the least squares reg. line to make predictions
13-4.1.1 Linear relationship and the sample correlation coefficient
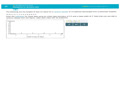
13-3.3.6 Box-and-whisker plots, Part 1
13-3.2.3 Sample standard deviation
13-3.2.2 Population standard deviation
13-3.2.5 Comparing standard deviations without calculation
13-3.1.9 Mean, median, and mode - comparisons
13-3.1.3 Weighted mean - tabular data
13-3.1.2 Rejecting unreasonable claims based on average statistics
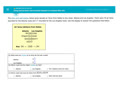
13-3.1.8 Mean, median, and mode: computations
13-3.1.4 Comparing means without calculation
13-3.2.1 Using back-to-back stem-and-leaf displays to compare data sets
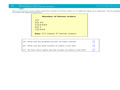
13-2.3.1 Interpreting a stem-and-leaf display
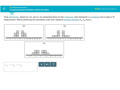
13-2.2.3 Interpreting relative frequency histograms
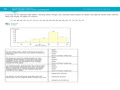
13-2.2.2 Frequency polygons for grouped data
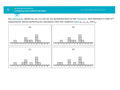
13-2.2.1 Histograms for grouped data
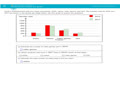
13-2.1.3 Interpreting a double bar graph
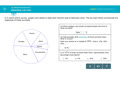
13-2.1.1 Interpreting a pie chart
13-1.2.2 Discrete versus continuous variables
13-3.3.4 Percentiles
13-R.17 Writing equation of the line given y-int. and another point
13-R.4 Writing a ratio as a percentage
13-R.6 and R.7 Solving a linear equation with several occurrences of variable (variables on one side and on both sides)
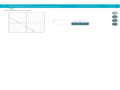
13-R.16 Graphing a line through a given point with a given slope
13-R.3 Converting between percentages and decimals
13-R13 and R.14 Graphing a line given its equation in slope-intercept form
13-R.1 Rounding decimals
Previous
Next